Dugout: an MLB text and voice chat displaying data using an adaptive design system.
- Role
- Designer and builder
- Outcome
- A web app I designed and built with Claude Code, with a code-based adaptive design system that displays results based on the questions asked by the user. It uses the MLB Stats API for data and LiveKit for voice chat.
The problem
During my time working on enterprise software that was very data rich, I thought about how AI experiences could work for inventory management, reporting or commission reconciliation. More specifically, how could a chat experience respond with large data sets in a way that answered the user’s questions. AI requires trust from the user, and building trust means showing proof of the answers sometimes.
The research
I’ve worked with design systems for years. I’ve not only built them and used them in Figma, I’ve built them and used them in AI projects and code with primitive and semantic tokens, components and rules and patterns.
My instinct and experience framed my hypothesis - which was that a chat agent could build data rich UIs on the fly based on what the user was asking for.
I looked at how baseball fans find stats today, and the answers sit behind filters, leaderboards and long lists of players.
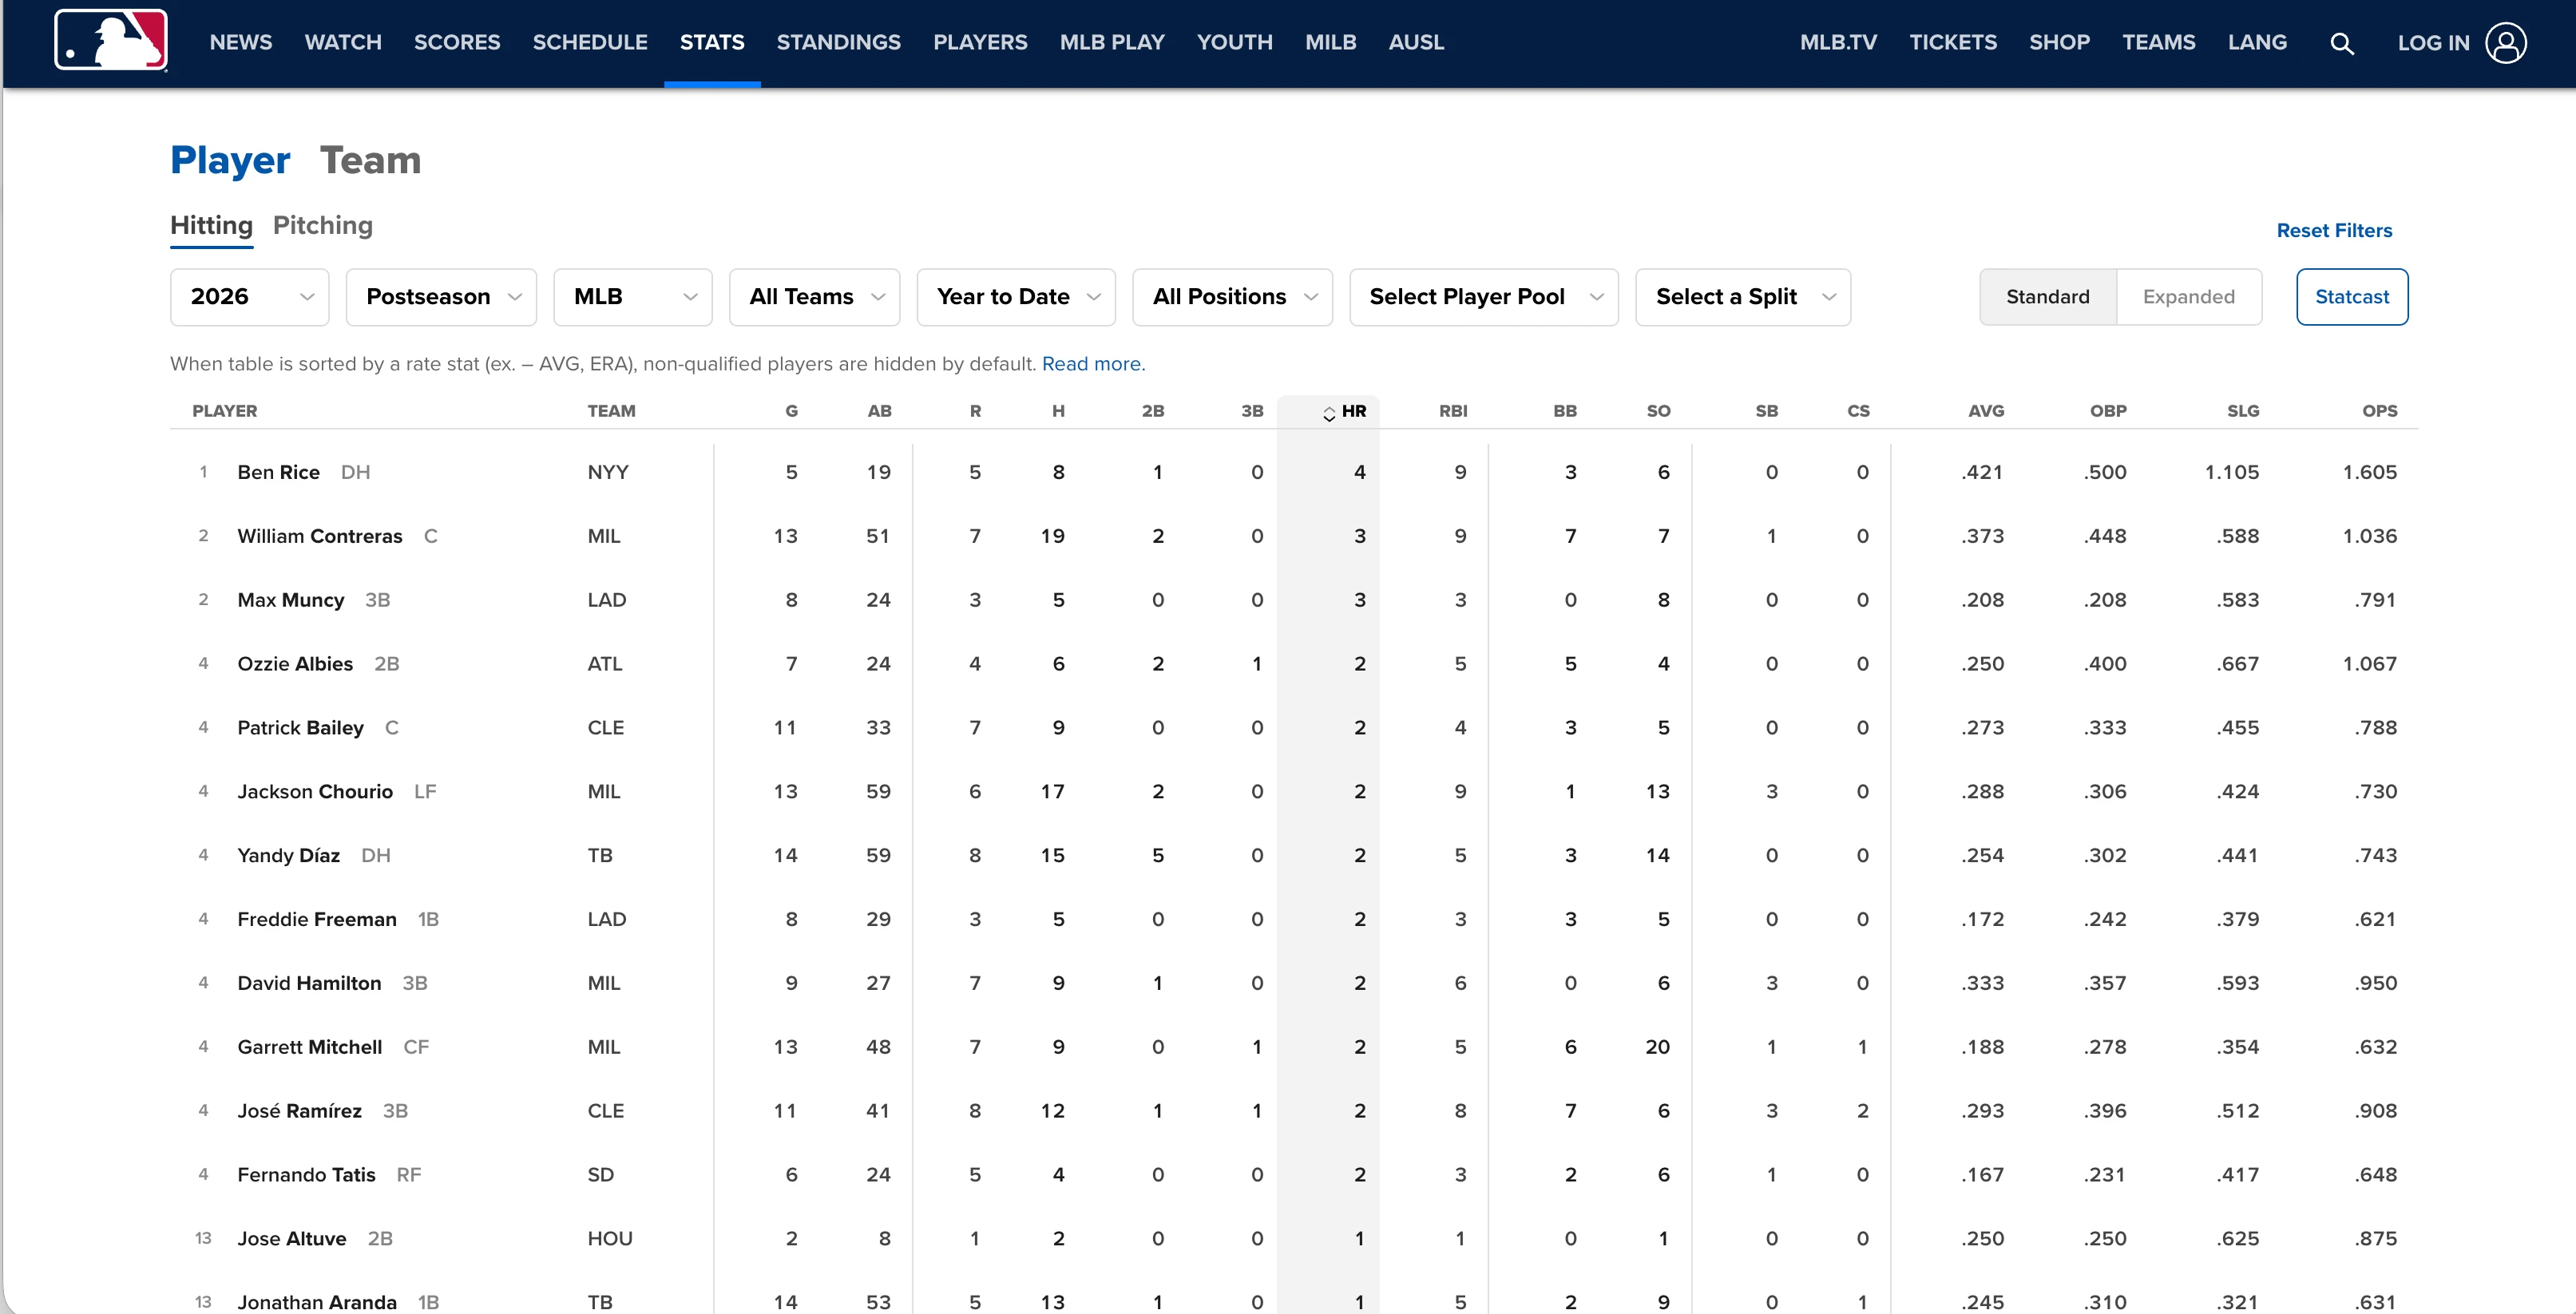
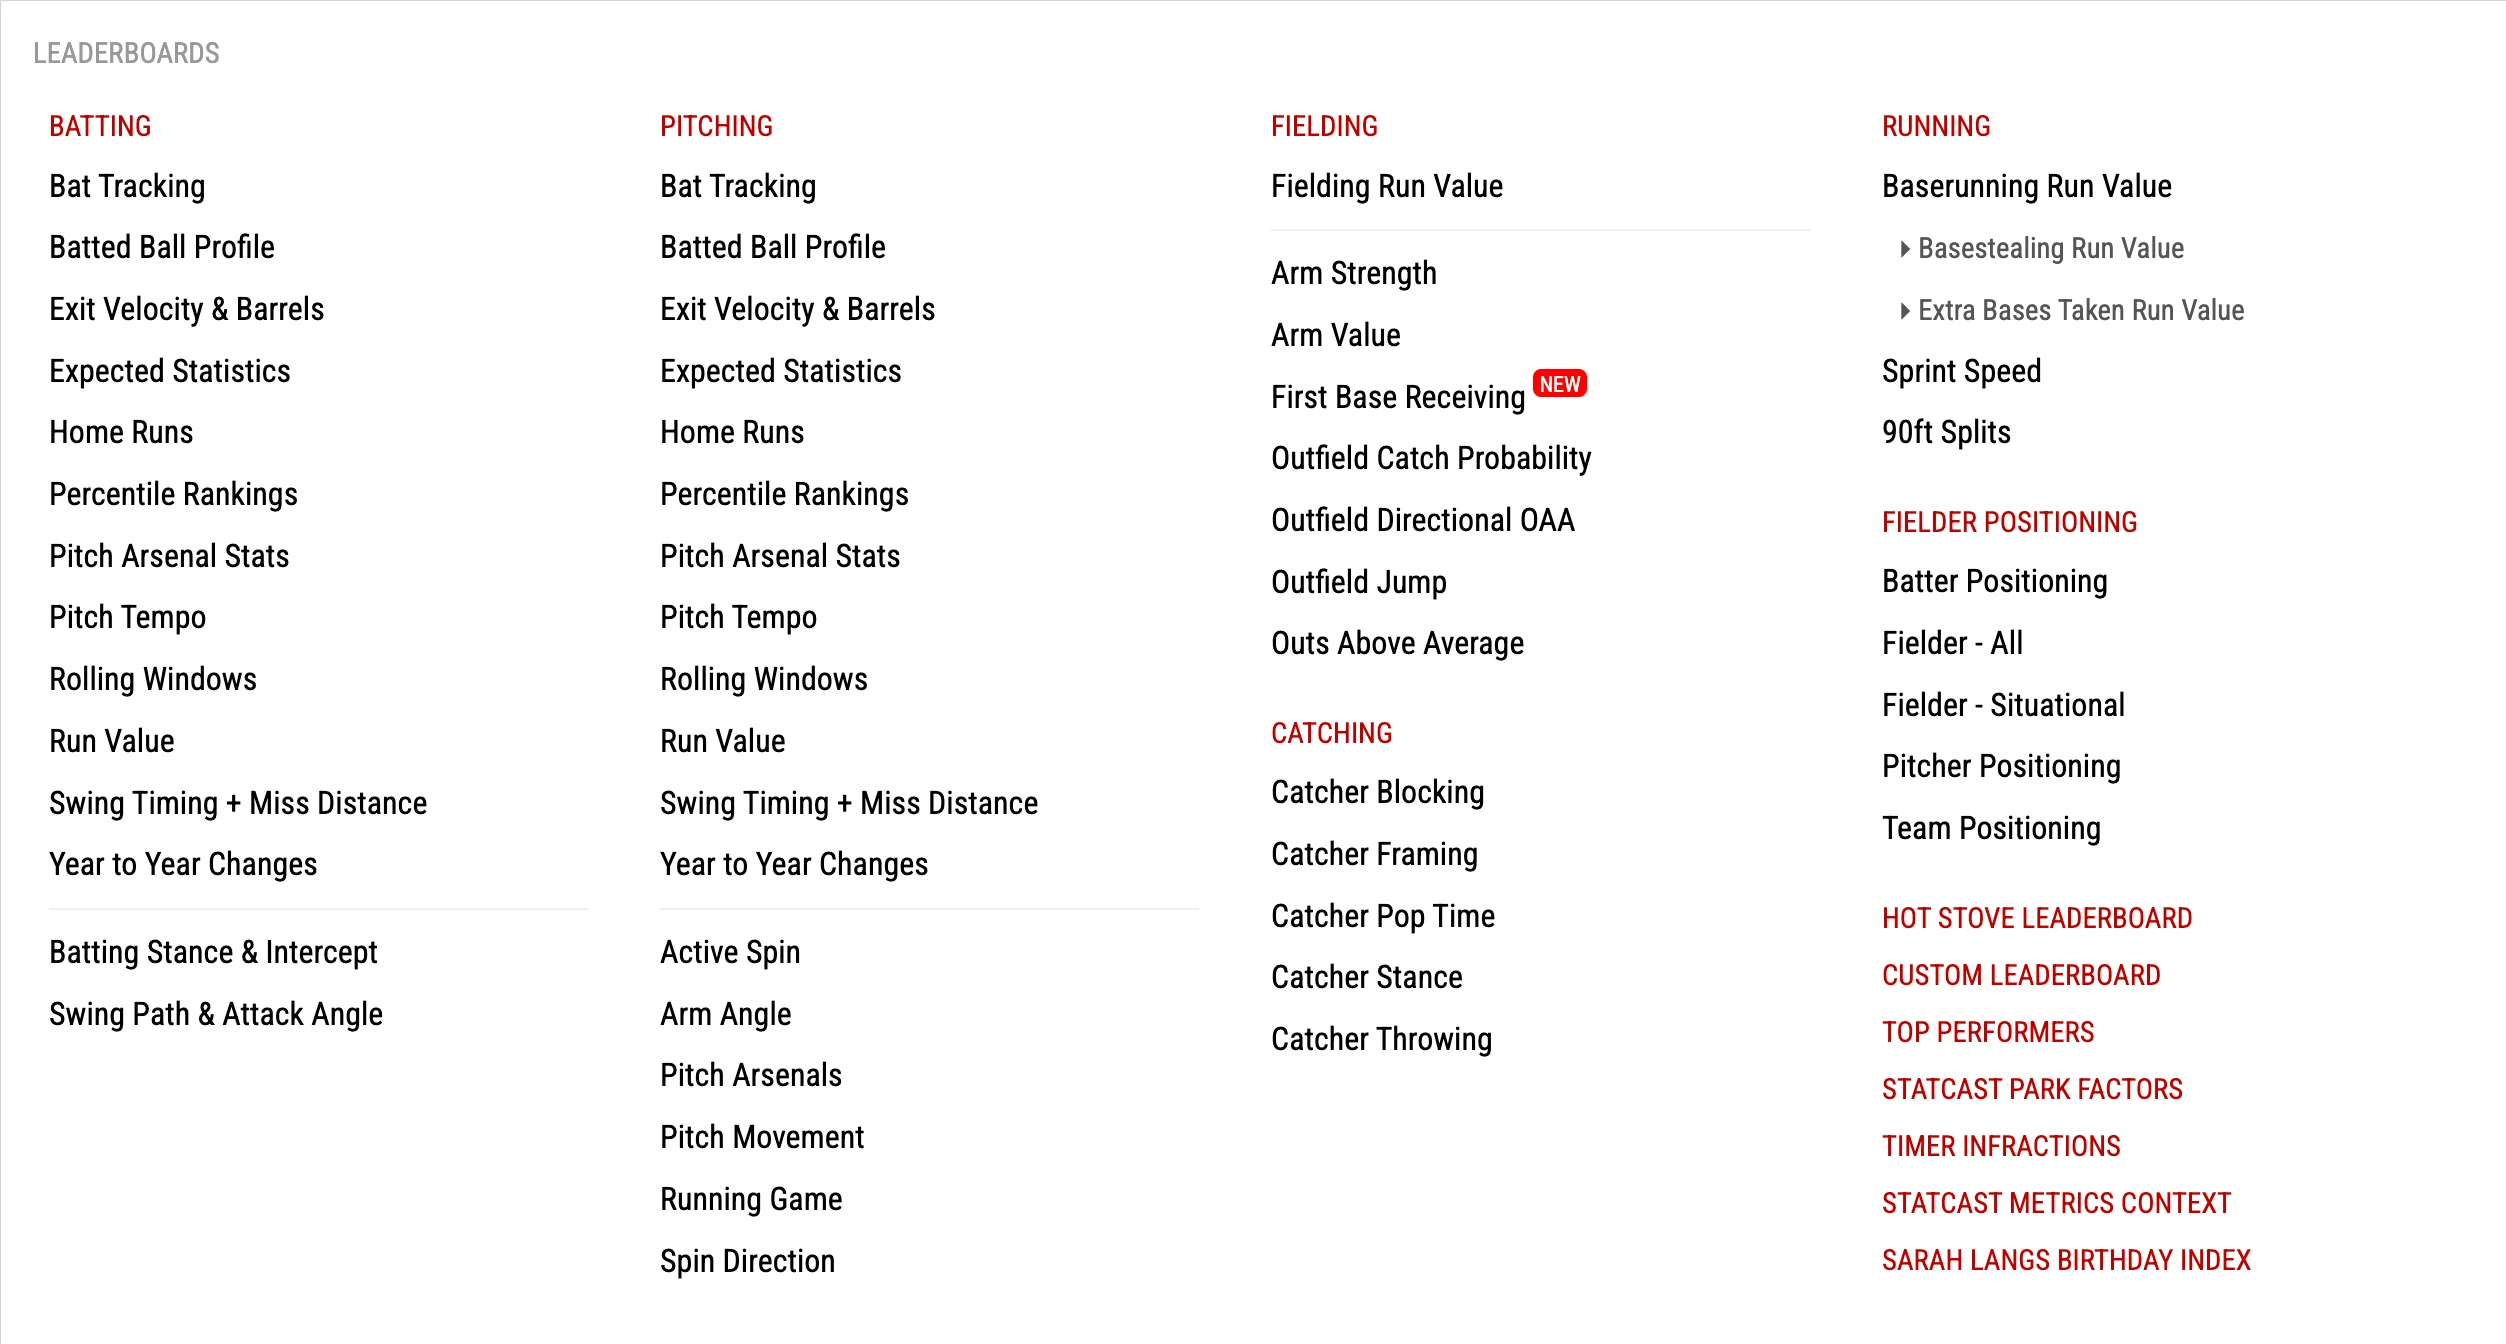
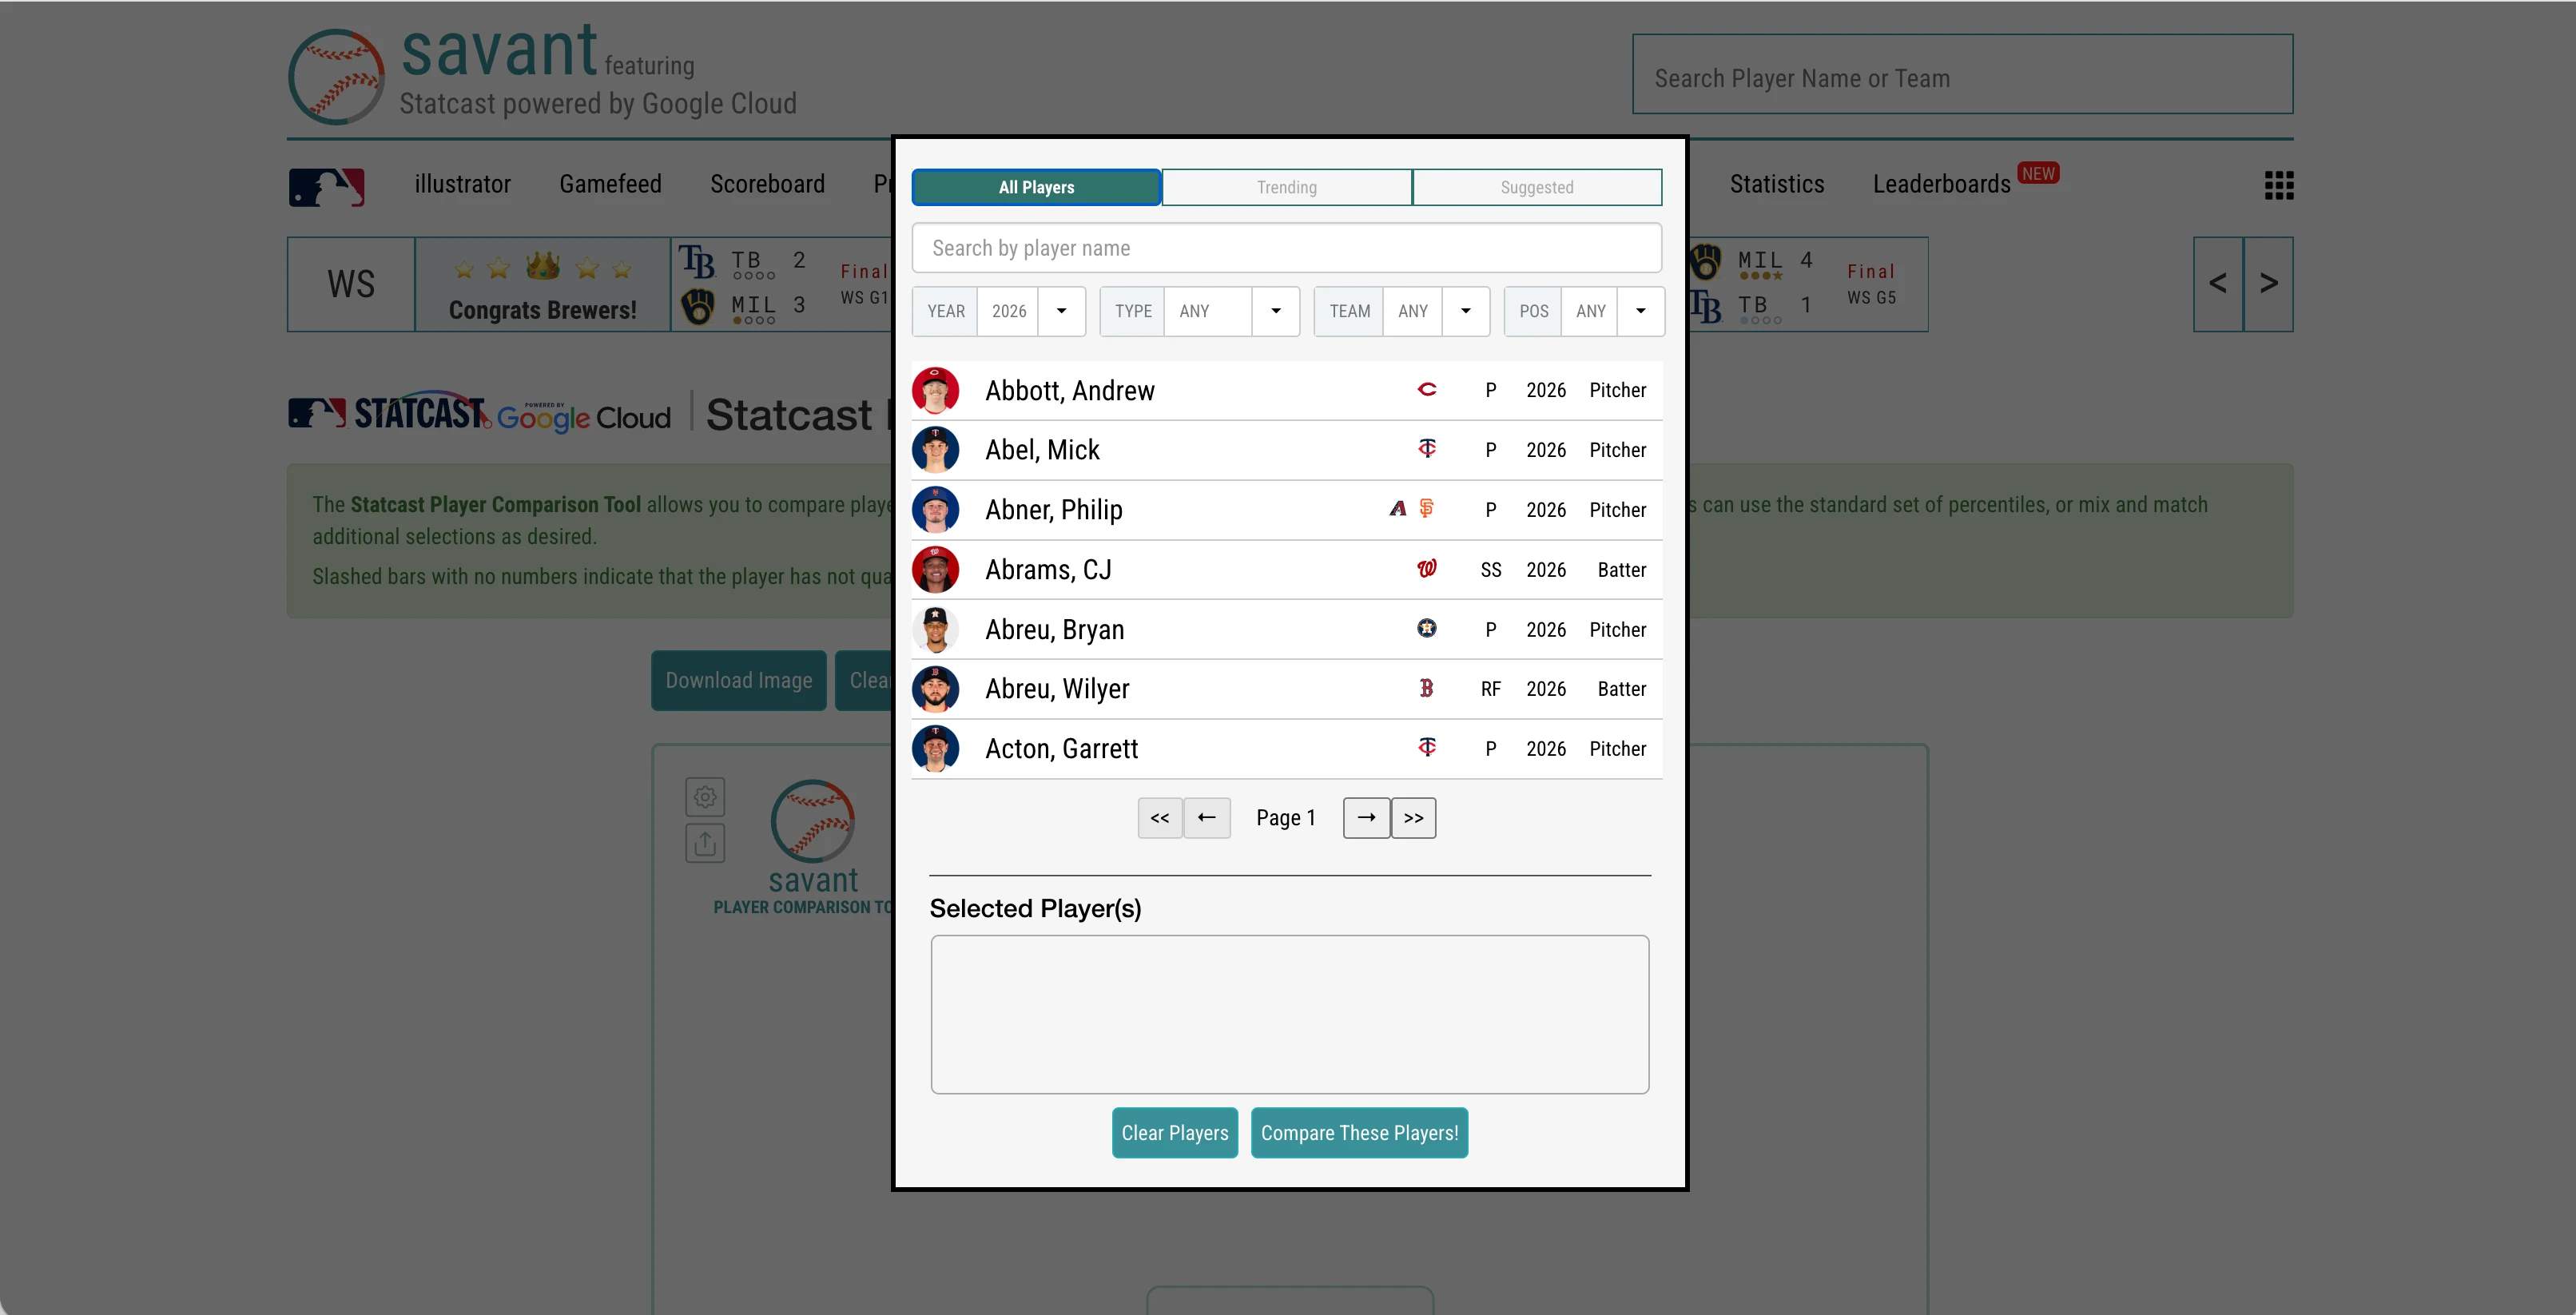
MLB.com’s stats table has eight filters.
Decisions and trade offs
I decided to build a responsive web app and use real data. I love baseball, and I learned the Major League Baseball stats API was free to use. While baseball is the theme, the concept is relevant to any data rich platform, and the goal with this project was to demonstrate the experience regardless of the data source.
I decided to build a design system first, with data visualizations for various scenarios like stat summaries, comparisons, rankings, and trends.
The work
Layouts
The design system included multiple layouts for data visualizations.

Tokens
It was also built as AA accessible using primitive and semantic tokens for style, motion, spacing etc.

Rules for an agent
The most critical part of the design system was the rules. It was not a developer or designer interpreting the rules - it was an agent. The rules defined the way the chat agent should speak, the language they can use, and how and when to display the data visualizations. The agent had to interpret the question, call the API to find the answer, and then show the results in the most meaningful display.

Voice
In addition to typing, I also built voice dictation, as well as Live chatting, which is a voice to voice feature. This added additional complexity around how the agent should respond in a voice conversation with data.
The hardest part to design was expectations. Voice to text is clear, but a spoken reply has to be clearly signalled. It would be awful to expect text and get a voice, so Live is its own feature, not part of the text chat.
A voice reply can’t show a chart. Dugout says the answer the person needs and a few of the numbers, and the full stats are one tap away.
Outcome
The app is hosted on a Vercel website, and has a functional integration with two separate systems. The MLB stats API and the LiveKit platform for voice.
I tested Dugout with 117 questions, asked in conversational language, including nicknames like “Vladdy”. Each question ran three times. Every question got the same layout and the same components on all three runs, and no answer showed a wrong number. Every answer was put together from the same seven layouts and one set of components, from one player’s season to the whole postseason bracket.
117
questions in conversational language
3
runs of every question
0
wrong numbers
7
layouts for every answer
I tested with a group of 8 people as well. Only one question did not provide a correct response, and that was due to an agent making a decision about excluding players that had not met a certain threshold of games.
What I would do differently
I would have made a different decision about using the MLB stats API. While I love baseball, I underestimated the complexity of baseball statistics. A lot of my time went into making sure Dugout picked the right player (since so many of them share the same name), season and stat before I could work on the layouts. A smaller set of data would have let me test the design system sooner.